


I think MSFT should be part of any long-term portfolio. It traded around $360 twice this year, but I got in at $429 and up 15% since then. Also, it’s a buy at $464 with potential double-digit returns.
It might eventually go through a drawdown again in the future depending on how AI CAPEX turns out, as a lot is riding on OpenAI and the ROI of their investment in the short term. But in the long run, say, more than 5 years, none of this should matter. They might’ve as well burned that cash literally and still be ok because these businesses are super dominant. Ask META with their metacrap.
Here is a mental model for Microsoft so you have a better understanding of the business: 50-30-15.
Think of Microsoft as having three engines. About half of the business is Azure and cloud services, which power businesses behind the scenes. About one third comes from Microsoft Office, including Microsoft 365, Teams, Outlook, and LinkedIn. The remaining about one fifth comes from Windows and Xbox, including Windows licenses, gaming, Surface devices, Bing, and Edge.
Now, let’s go through each step in detail.
Like and restack before you read on. It means a lot to me! Thank you!
Upgrade for $10/month or $120/year:
Posts: Every idea with its quality, growth, and valuation.
The full 20-name portfolio and 250-name watchlist.
Idea Generator: The 10,000-stock dataset to find your own Compounders.
Quality: Is this a compounder?
Absolutely.
Price and Performance
MSFT really took off after 2015 with Nadella as the CEO as it started growing closer to 20%. Look at the growth rates at the bottom of the chart, basically flat coming into 2015. Basically a dog of the market.
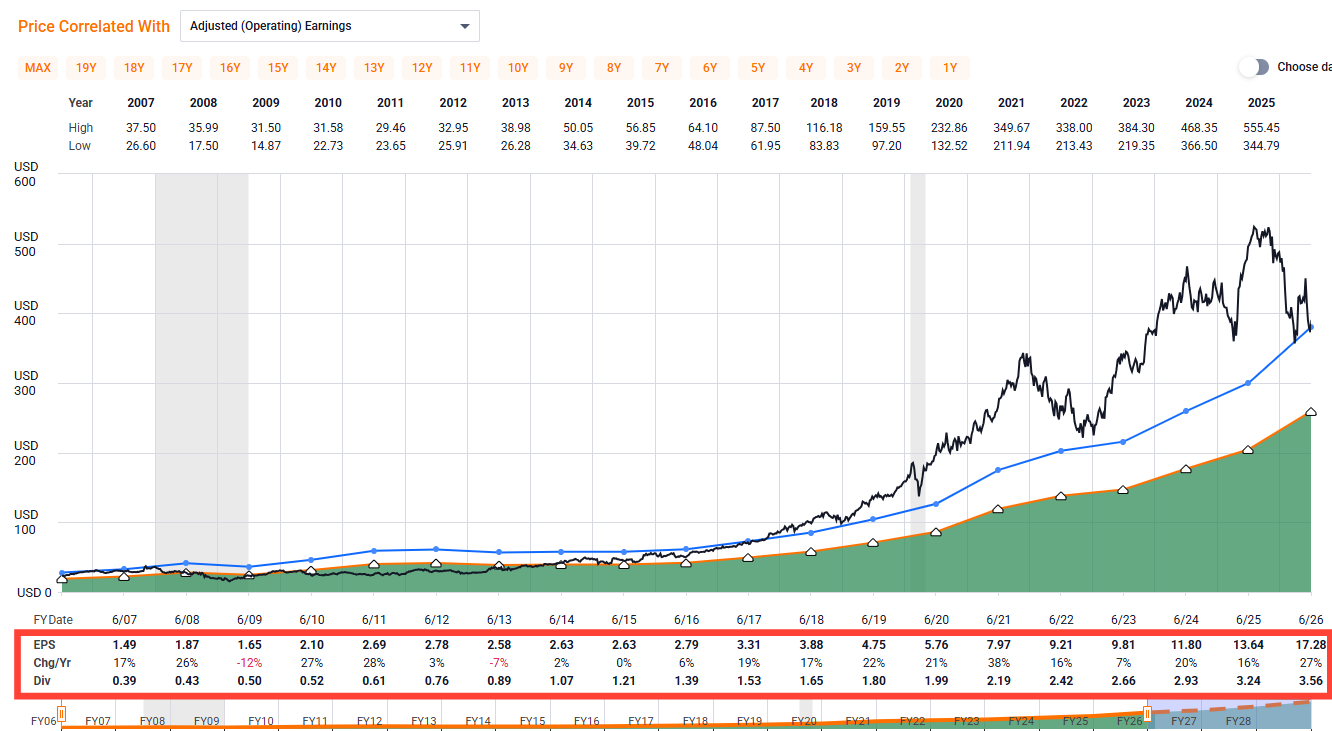
And the return reflected that with a 7.4% annual return for 8.4% EPS growth from 2006 to 2015. This is clear evidence that price follows the business performance.

Now look at the return since 2015. The company’s EPS increased by 18% annually while returning 27% due to the multiple expansion.

Now, let’s see what a committee of about 20 experienced Morningstar equity analysts have to say about its moat.
Moat and Management
Everyone knows that Microsoft is one of the world’s most dominant businesses, thanks to Azure, Office, and Windows.
I trust Morningstar’s moat ratings more than mine because a committee of about 20 experienced analysts beats my analysis for sure.
Here is what Morningstar has to say about the moat:
For Microsoft overall, we assign a wide economic moat, arising primarily from switching costs, with network effects and cost advantages as secondary moat sources. Based on the company’s segments, we believe the productivity and business processes and intelligent cloud segments have earned wide moats, and the more personal computing unit warrants a narrow moat. We believe Microsoft’s moat will probably allow the company to earn returns in excess of its cost of capital over the next 20 years.
Also, they assign an exemplary rating for their management (poor, standard, or exemplary). We are definitely in good hands.
We assign Microsoft an Exemplary Capital Allocation Rating. The rating reflects our assessments of a sound balance sheet, exceptional investments, and appropriate shareholder distributions. We think investments back into the business are most likely to be the key driver of total shareholder returns and are therefore appropriately prioritized over other capital returns such as dividends and buybacks, although given the firm’s prodigious free cash flow generation, we see share dividends, buybacks, and acquisitions continuing.
Read about the Morningstar rating system here.
Growth: Is it likely to continue?
Yes.
What does the analyst consensus say?
Analysts, about 40+ of them, think that MSFT will grow revenue 17% and EPS 19% in the next 5 years. It’s kind of ridiculous to grow close to 20% at this scale.



Can they model this business?
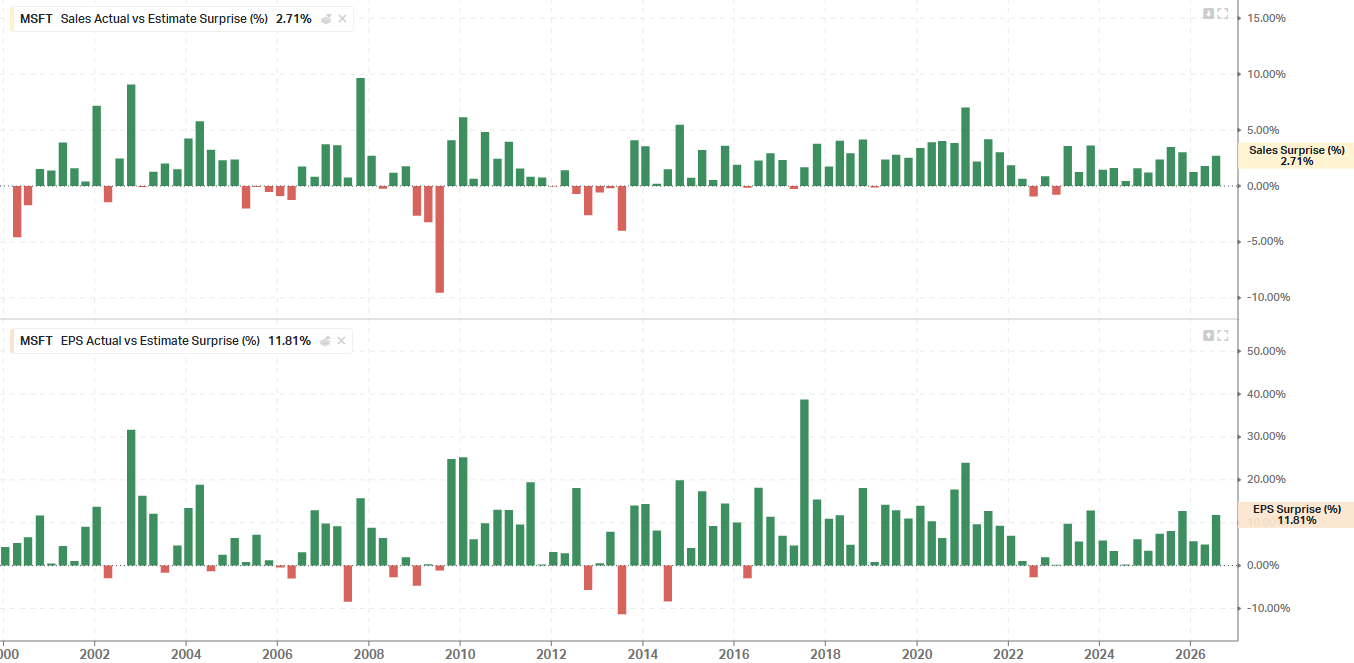
Yes. Analysts are able to model this business pretty accurately because the average surprise for revenue is 1-2%, while it’s about 10% for EPS. And for some reason, MSFT keeps surprising the analysts with EPS beats. Underpromise and overdeliver?
Let’s take a look at the fair value and potential return in the next section.
Valuation: Is it a buy today?
Yes.
What the Market Has Paid

EPS went from $1.49 in FY07 to $17.28 in FY26. Two down years, as FY09 was -12% and FY13 was -7%. Every year was up and the market handed the stock a 22x average multiple.
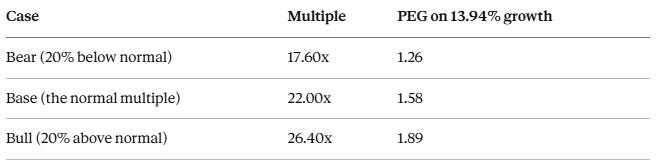
That 1.58 PEG is the number that the buyers have been willing to pay.
Today the blended multiple is 26.6x.
Now, let’s see what we can make based on what we assume.
What You Actually Make
Consensus has Microsoft growing earnings 17% a year for the next 5-6 years. This is from FactSet research, while S&P Capital IQ has it at 19%. I’ll be using the FS as that’s the default on FASTGraphs and is more conservative of the two.
Using the 1.58 PEG the market has paid, then flexing 20% each way:
Here are the returns. Two hold periods, the shorter one first.
Hold to June 30, 2028:
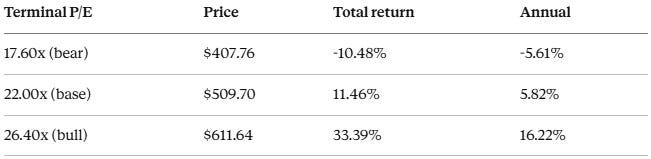
Why two hold periods? Because the shorter you hold, the more your outcome depends on the exit multiple and the less it depends on the business. Two years out, a multiple that goes from 26x to 17x costs you money even though earnings grow 17% a year. Stretch the hold, and earnings do the heavy lifting while the multiple noise washes out.
Hold to June 30, 2032:
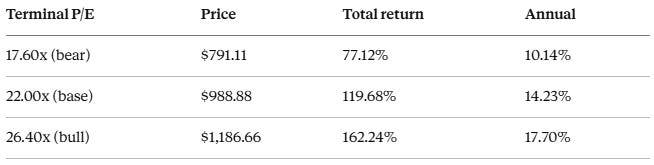
Look at what six years does to the bear case. Losing 6% a year over two years becomes making 10% a year over six. Same multiple collapses but completely different outcome.
Now the fair value math on NTM EPS of $19.18:
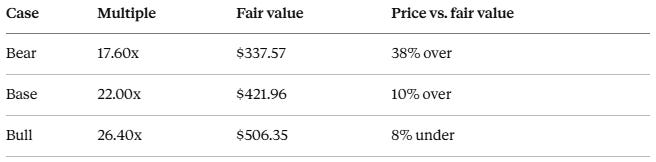
The MSFT fiscal calendar ends in June. So, the NTM EPS is basically for the year 2027.
At $464 the stock is trading around a conservative fair value estimate. Nothing crazy. If you buy here and the multiple holds at 22x, the six-year math gives you about 14% a year. If it compresses to 18x, you still get 10%.
Do you own it? Why not? Comment below.